Ok, we seen on a first article how to record signal from the input of an usb sound card. But our objective is not to just «ear the sound of current» but our objective is to make a measurement.
Displaying waves with python
For quick and dirty displaying we can use the opensource sound software audacity . But for more computation, and for the end application I used python with the following script found on stackoverflow:
import matplotlib.pyplot as plt
import numpy as np
import wave
import sys

spf = wave.open('foobar.wav','r')

#Extract Raw Audio from Wav File
signal = spf.readframes(-1)
signal = np.fromstring(signal, 'Int16')

plt.figure(1)
plt.title('Signal Wave...')
plt.plot(signal)
plt.show()
Saturation
There is a problem with sound card Line in : its voltage level limit is low ~400mVpp depend to volume input control. Then recorded signal is dramatically saturated by the sound card. As we can see on the following measurement curves
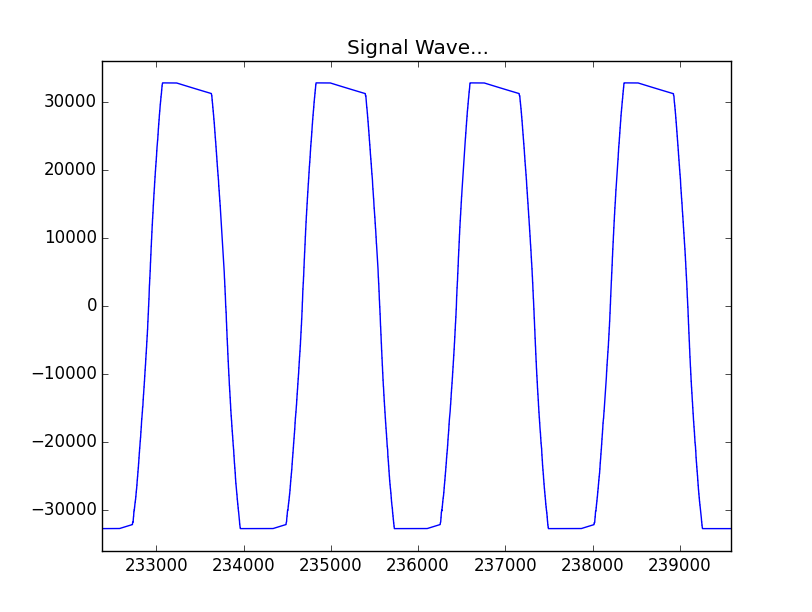
toaster current curve : saturated
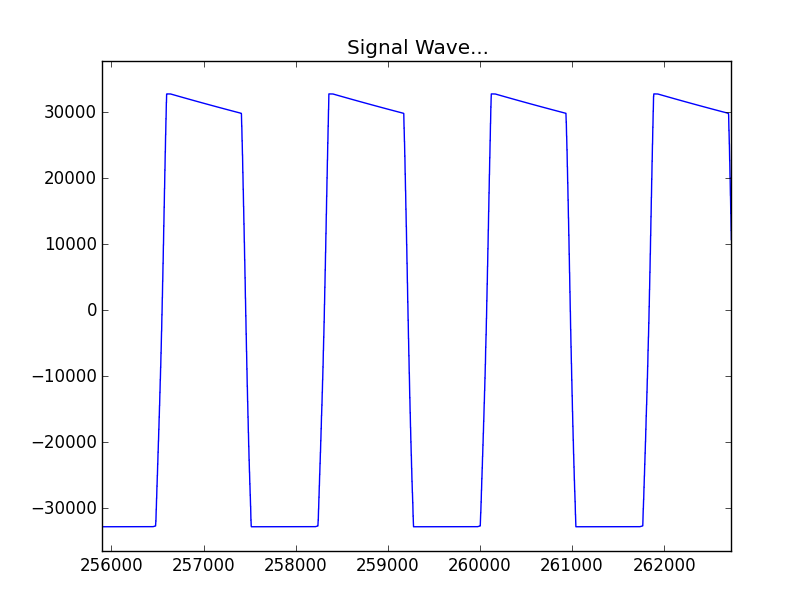
Kettle and toaster current curve : saturated
To solve this problem, I simply soldered resistor divider to divide by ~10 the input signal level. Then I get good signal entry.

Voltage dividor
To unsure that signal level will not saturate, don’t forget to set input sound level at maximum with alsamixer :
$ alsamixer
We can then obtain a not saturated signal :
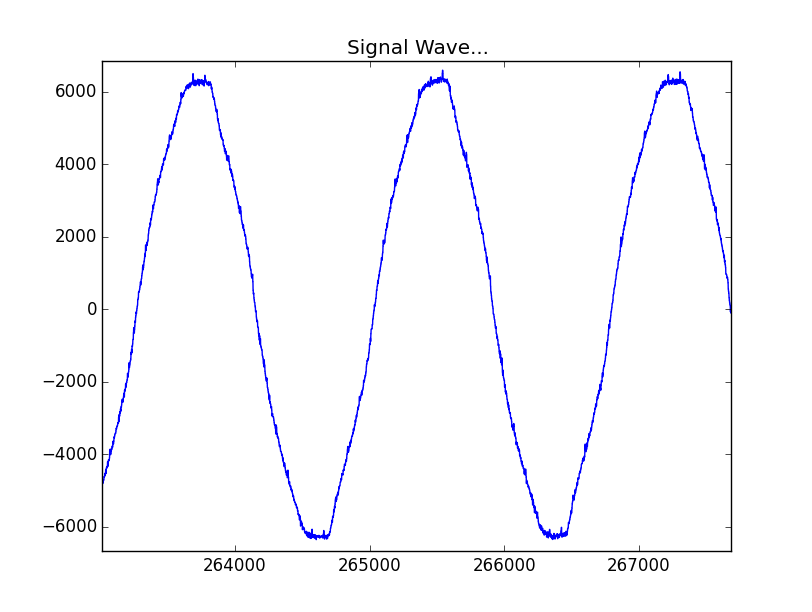
Toaster plus kettle current curve not saturated
Plugging it on raspberrypi and electric distribution board.
In my house, the electric distribution board and internet box are under the same cupboard then it’s easy to connect current probe + raspberrypi + usb sound card and it’s power (tricks: to power the raspberrypi you can use the usb plug from your box instead of power wall adapt).
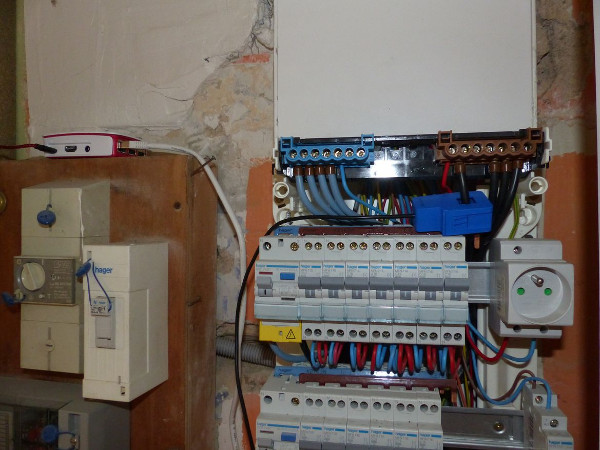
Wire plug in my electric cupboard
Visualize the sound of your house electric consumption
I can now make measurement from the raspberrypi then download wave on computer to see the my house electric consumption.
ssh pi@192.168.0.111
arecord -d 10 -f cd -D plughw:1 -t wav foobar.wav
This above command give is not stopping after ten seconds like on my laptop and give me multiple files of 44Bytes. I don’t know why ?
Once it recorded we can download it with scp on laptop :
$ scp pi@192.168.0.111:~/foobar-* .
Then display it with my little python script :
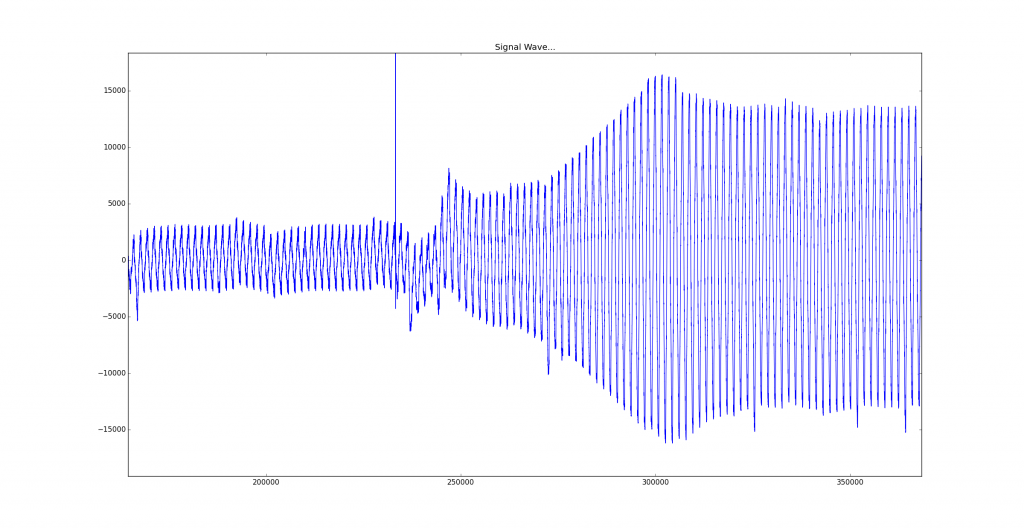
Electric consumption before and after power on the inductive hot plate for boiling water.
In a futur article we will see how to calculate the RMS current with a deamon and save it in raspberrypi to see the consumption history.

